Overview
The Zipkin service is a distributed tracing system. It helps gather timing data needed to troubleshoot latency problems in service architectures. Its features include both the collection and lookup of this data. Zipkin tracer is the EOSIO component that sends traces to the Zipkin service. The Zipkin service can be installed in the local environment or it can be remote.
How To Enable Zipkin Tracer
EOSIO makes available Zipkin tracer through the core chain_plugin. To enable the Zipkin tracer you must set the telemetry-url parameter for the chain_plugin. There are two additional parameters you can set: telemetry-service-name and telemetry-timeout-us. All three available parameters are detailed below:
telemetry-urlspecifies the url of the Zipkin service, e.g. http://127.0.0.1:9411/api/v2/spans if it is installed in the local environment.telemetry-service-namespecifies the ZipkinlocalEndpoint.serviceNamesent with each span.telemetry-timeout-us, optional parameter, specifies the timeout for sending zipkin spans with default value set to 200000.Zipkin tracersends zipkin spans, in json format, to theZipkin servicevia HTTP POST requests on a separate thread.telemetry-timeout-usspecifies how long to allow each HTTP POST request before reaching the time out and thus fail. Nine consecutive failures will disable theZipkin traceruntil a restart ofnodeosdaemon occurs.
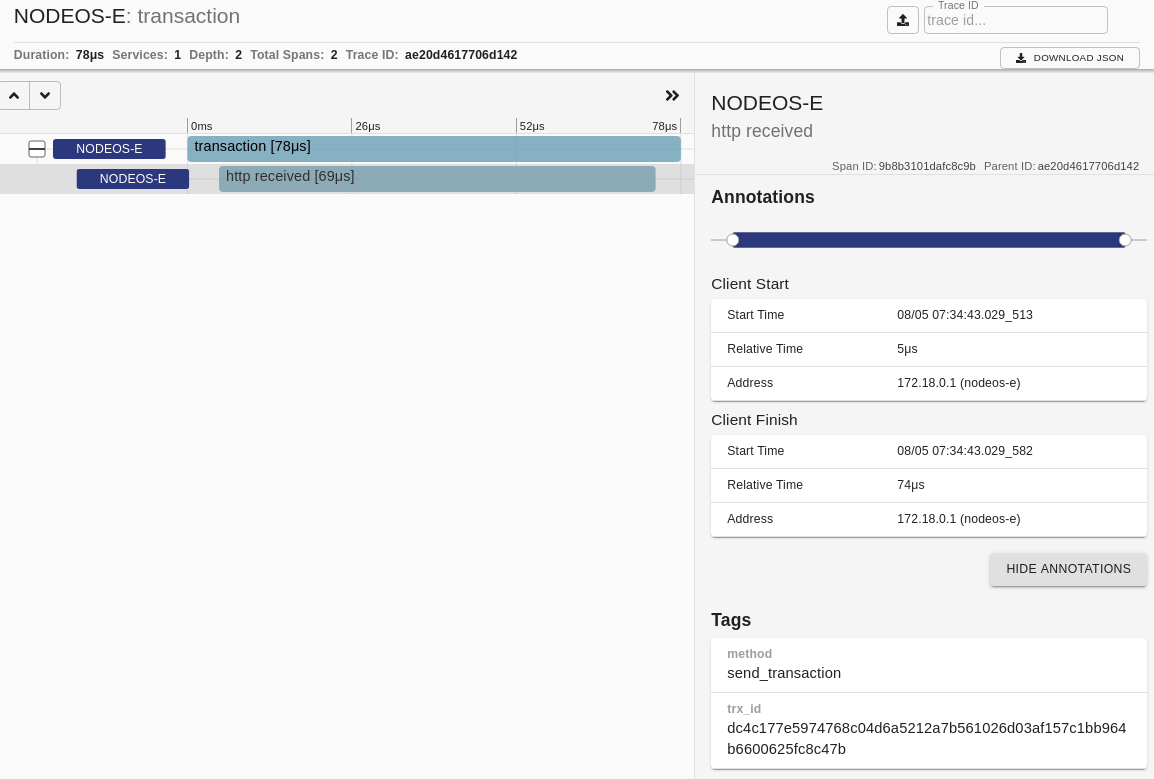
Once Zipkin tracer is enabled you can observe the detailed traces it sends to the Zipkin service. Examples of such traces are given below.
Submitted transaction:

Processed transaction:

Block accepted:

SHiP Accepted: